
Post believes that transparency of environmental performance data is core to being a responsible company. Our company is committed to the ongoing collection of relevant data and monitoring of environmental performance based on energy sourcing and usage, greenhouse gas (GHG) emissions, water usage, wastewater and waste generation and recycling from our owned and operated production facilities all located in North America and the United Kingdom.
Post also monitors environmental performance data for owned and operated offices, warehouses and distribution centers, and joint ventures.
- In this Section
- Environmental Data
- GHG Emissions
- Water Stewardship
- Biodiversity and Deforestation
- Sustainable Packaging
- Waste Minimization
- Collective Action
Production and Office Data
| Metric | Unit | FY2022 | FY2023 | FY2024 | FY2025 |
|---|---|---|---|---|---|
| Purchased Electricity Absolute | MWh | 840,505 | 827,186 | 792,179 | 795,061 |
| Purchased Electricity Intensity (Production Volume) | MWh / million pounds of product | 141 | 139 | 141 | 132 |
| Purchased Electricity Intensity (Net Sales) | MWh / million USD net sales | 144 | 118 | 100 | 97 |
| Total Energy Consumption | MWh | 2,966,880 | 3,014,856 | 2,773,114 | 2,751,998 |
| Total Energy Consumption Intensity (Production Volume) | MWh / million pounds of product | 497 | 506 | 495 | 458 |
| Total Energy Consumption Intensity (Net Sales) | MWh / million USD net sales | 507 | 431 | 350 | 337 |
| Scope 1 GHG Emissions Absolute | MTCO2e | 380,807 | 390,651 | 358,491 | 355,662 |
| Scope 1 GHG Emissions Intensity (Production Volume) | MTCO2e / million pounds of product | 64 | 66 | 64 | 59 |
| Scope 1 GHG Emissions Intensity (Net Sales) | MTCO2e / million USD net sales | 65 | 56 | 45 | 44 |
| Scope 2 GHG Emissions Absolute | MTCO2e | 318,234 | 318,639 | 299,060 | 282,985 |
| Scope 2 GHG Emissions Intensity (Production Volume) | MTCO2e / million pounds of product | 53 | 54 | 53 | 47 |
| Scope 2 GHG Emissions Intensity (Net Sales) | MTCO2e / million USD net sales | 54 | 46 | 38 | 35 |
| Scope 1 & 2 GHG Emissions Absolute | MTCO2e | 699,041 | 709,290 | 657,551 | 638,647 |
| Scope 1 & 2 GHG Emissions Intensity (Production Volume) | MTCO2e / million pounds of product | 117 | 119 | 117 | 106 |
| Scope 1 & 2 GHG Emissions Intensity (Net Sales) | MTCO2e / million USD net sales | 119 | 101 | 83 | 78 |
| Water Withdrawal Absolute | million gallons | 3,226 | 2,881 | 3,011 | 3,048 |
| Wastewater Discharge Absolute | million gallons | 1,928 | 1,793 | 1,996 | 1,992 |
| Water Use Absolute | million gallons | 1,298 | 1,088 | 1,015 | 1,056 |
| Water Use Intensity (Production Volume) | gallons / pound of product | 0.217 | 0.182 | 0.181 | 0.176 |
| Water Use Intensity (Net Sales) | gallons / USD net sales | 0.222 | 0.156 | 0.128 | 0.129 |
| Production Sites in Regions with High Baseline Water Stress | Percentage | 3% | 2% | 2% | 5% |
| Production Site Groundwater Use in Regions with High Baseline Water Stress | Percentage | – | – | 0% | 0% |
| Production Site Municipal Water Use in Regions with High Baseline Water Stress | Percentage | – | – | <1% | 5% |
| Non-Hazardous Waste Generated Intensity (Production Volume) | pounds / pound of product | 0.146 | 0.123 | 0.134 | 0.120 |
| Non-Hazardous Waste Generated Intensity (Net Sales) | pounds / USD net sales | 0.149 | 0.105 | 0.095 | 0.088 |
| Landfill Diversion | Percentage | 90% | 90% | 90% | 91% |
| Non-Hazardous Waste Recycled | million pounds | – | 657 | 673 | 653 |
| Non-Hazardous Waste Disposed | million pounds | – | 75 | 76 | 67 |
| Net Sales | million USD | 5,851 | 6,991 | 7,923 | 8,158 |
Scope 1 and 2 Greenhouse Gas Goal Data
We are committed to a 30% reduction in absolute GHG emissions in our direct operations (scope 1 and scope 2) by 2030 (fiscal year 2020 baseline). Our Weetabix business has additional targets validated by the science-based targets initiative (SBTi) as a pilot for our organization. Compared to our fiscal year 2020 goal baseline, we have decreased scope 1 and 2 GHG absolute emissions by 15% and emissions intensity versus production volume by 25% for baseline sites.
| Metric | Unit | FY2020 | FY2025 | Percent Change |
|---|---|---|---|---|
| Scope 1 GHG Emissions Absolute | MTCO2e | 314,639 | 303,266 | -4% |
| Scope 2 GHG Emissions Absolute | MTCO2e | 331,882 | 246,860 | -26% |
| Scope 1 & 2 GHG Emissions Absolute | MTCO2e | 646,521 | 550,126 | -15% |
Scope 3 Greenhouse Gas Data
We are committed to a 30% scope 3 GHG emissions intensity reduction from sourced ingredients and packaging by 2030. In March 2026, we revised our scope 3 emissions data to include changes in our operational footprint, including the pet business, and the use of more accurate and granular annual procurement spend data. We have used this data to again estimate our global scope 3 GHG emissions using the spend-based calculation method. Future monitoring and measurement of scope 3 GHG emissions will utilize the HowGood platform.
| Metric | Unit | FY2023 | FY2024 | FY2025 |
|---|---|---|---|---|
| Scope 3 GHG Emissions Absolute | MTCO2e | 7,355,173 | 6,518,245 | 6,650,474 |
| Scope 3 GHG Emissions Intensity (Production Volume) | MTCO2e / million pounds of product | 1,234 | 1,163 | 1,106 |
| Scope 3 GHG Emissions Intensity (Net Sales) | MTCO2e / million USD net sales | 1,052 | 823 | 815 |
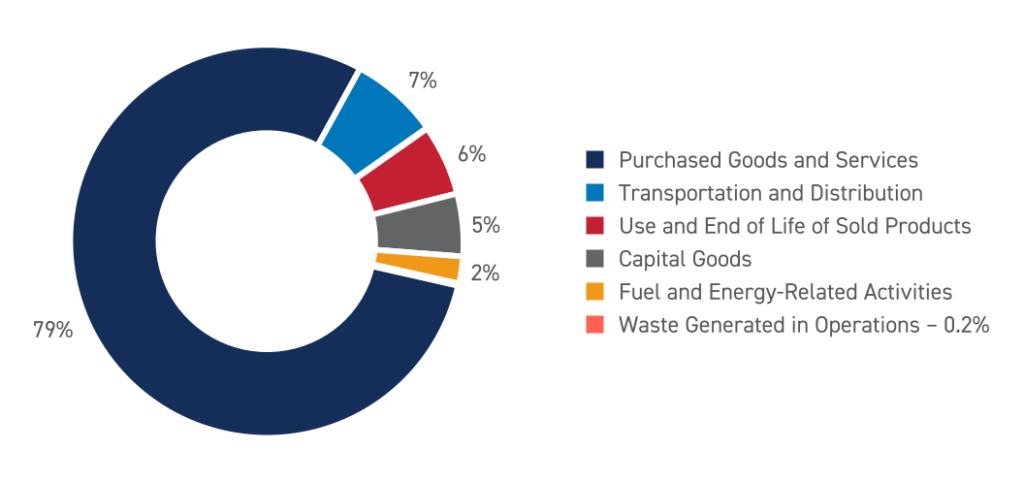
| Scope 3 Category – Purchased Goods and Services | MTCO2e | 5,999,759 | 5,219,790 | 5,217,466 |
| Scope 3 Category – Capital Goods | MTCO2e | 291,922 | 327,711 | 343,015 |
| Scope 3 Category – Fuel and Energy-Related Activities | MTCO2e | 161,198 | 147,145 | 146,016 |
| Scope 3 Category – Transportation and Distribution | MTCO2e | 498,222 | 443,966 | 487,341 |
| Scope 3 Category – Waste Generated in Operations | MTCO2e | 13,083 | 13,255 | 11,474 |
| Scope 3 Category – Use and End of Life of Sold Products | MTCO2e | 390,990 | 366,378 | 391,160 |
The following is a graphical summary of scope 3 GHG data by category.
For purchased goods and services, the largest category of scope 3 GHG emissions, the following are
estimated to be the largest subcategory contributors:
- Agricultural-based ingredients and raw materials: 73%
- Electricity, gas and water supply: 14%
- Pulp and paper, rubber and plastics: 6%
- The remaining emissions within this category are split across multiple small-portion subcategories.
We have started to utilize the HowGood platform to further evaluate and profile the GHG emissions by ingredient category. The following is an initial baseline profile.
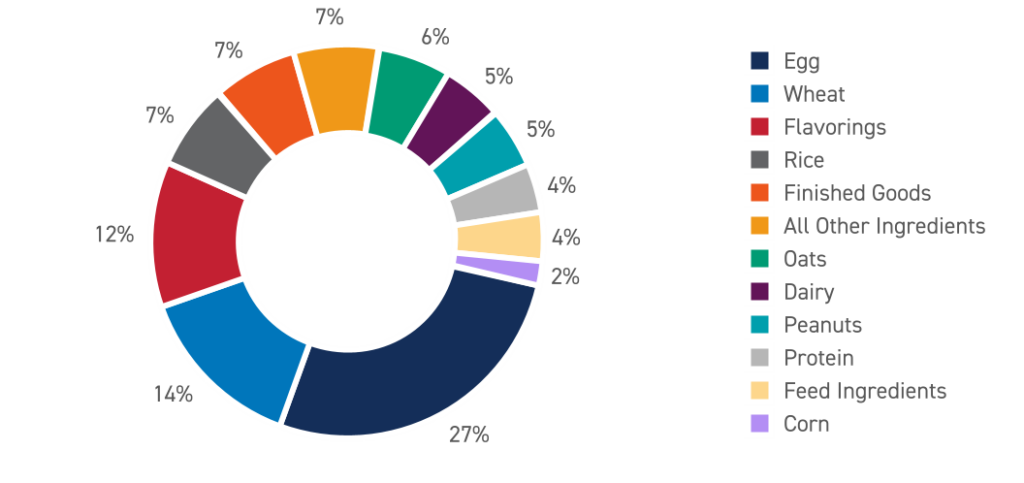
The following provides a breakdown of our scope 3 GHG ingredient-related emissions by business and the largest source of ingredient emissions.
| Metric | Post Consumer Brands (includes 8th Avenue Food & Provisions, Inc.) | Foodservice | Refrigerated Retail | Weetabix |
|---|---|---|---|---|
| Percentage of Total Global Scope 3 Ingredient Emissions | 52% | 41% | 4% | 3% |
| Largest Source of Ingredient Emissions | Wheat | Egg | Protein | Wheat |
Scope 3 Greenhouse Gas Goal Data
The following shows our progress toward our scope 3 GHG intensity goal against a fiscal year 2021 baseline. In March 2026, we revised our scope 3 emissions data to include changes in our operational footprint, including the pet business, and the use of more accurate and granular annual procurement spend data.
| Metric | Unit | FY2021 | FY2023 | FY2025 | Percent Change (FY21 to FY25) | Percent Change (FY23 to FY25) |
|---|---|---|---|---|---|---|
| Scope 3 GHG Emissions Intensity (Net Sales) | MTCO2e/million USD net sales | 990 | 1,052 | 815 | -21% | -29% |
| Scope 3 GHG Emissions Intensity (Production Volume) | MTCO2e / million pounds of product | 879 | 1,234 | 1,106 | +20% | -12% |
The above data represents current accuracy as tracking allows with values adjusted from previously disclosed data based upon identified corrections, enhanced data management methodologies and adjustments to our organization from acquisitions and divestitures. The above data includes our owned and operated production locations for Bob Evans Farms, Crystal Farms, 8th Avenue Food & Provisions, Michael Foods, Post Consumer Brands, Weetabix, and our corporate offices. Acquisitions that have not been owned or operated for a full fiscal year have been excluded from current fiscal year environmental values. Net sales values as reported in the Post Holdings Annual Report. Our original scope 3 GHG emissions baseline for fiscal year 2021 was estimated using The Scope 3 Evaluator Tool, developed by The Greenhouse Gas Protocol, using the spend-based method with data from Bob Evans Farms, Crystal Farms, 8th Avenue Food & Provisions, Michael Foods, Post Consumer Brands, Weetabix, and Post Holdings, Inc. This baseline has been updated annually using the best available annual procurement spend data and relevant sustainability performance data by category. Future scope 3 emissions will be estimated using the HowGood platform. During our fiscal year 2024 data review, we identified inconsistencies and regional changes in waste definitions and calculations for fiscal years 2020-2022, so the values are not displayed above. The original values for these years were originally published in our previous annual sustainability reports.